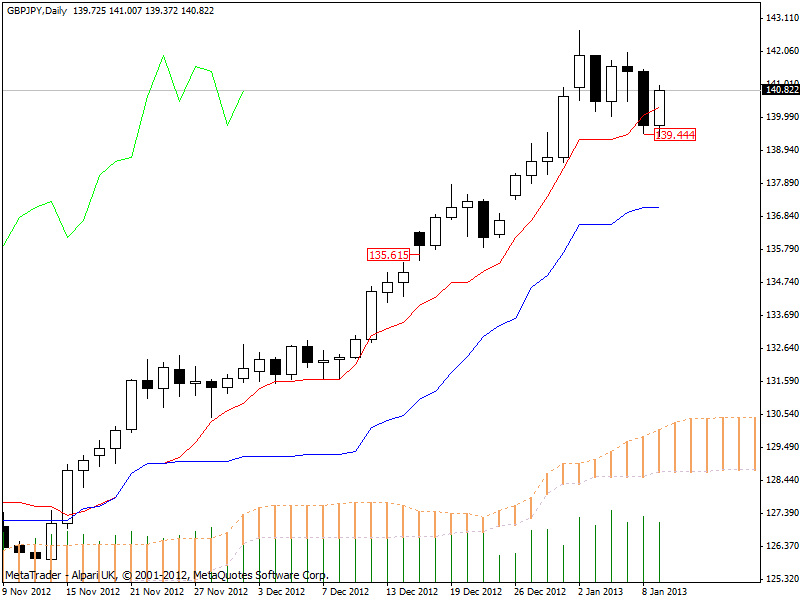
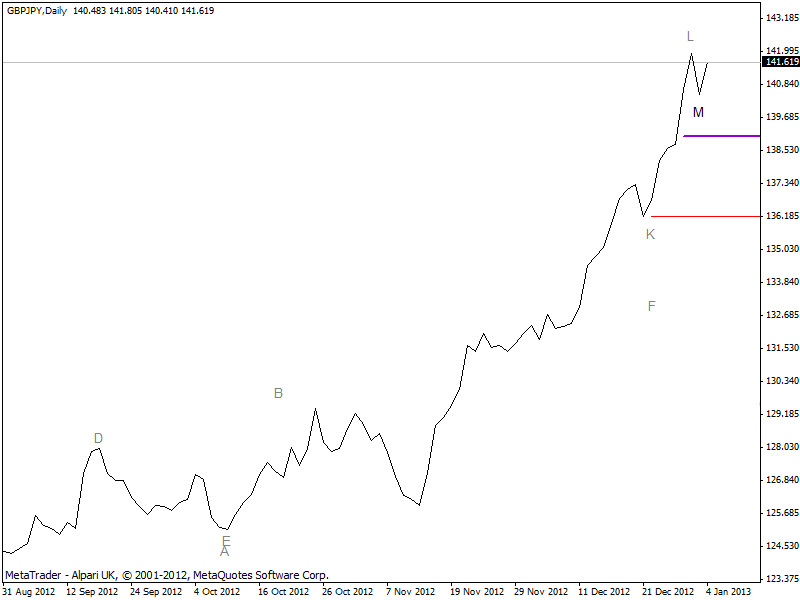
My twitter followers will know already that my trade on this pair hit its stop and closed out for a profit of 3,829 pips last night. Typical that it was soon after I see that price purely bounced from this area back upwards, had my stop been lower I would still be in this trade, but, thats just the greed emotion doing it's thing as we know that we must have a stop somewhere.
Anyhow, this is the part where I summarise the trade and see where I could have done better. Remember, post trade analysis is crucial as it reveals how well you followed your trading plan, and how well your trading plan is performing and often highlights any areas for improvement.
STATS VALUE
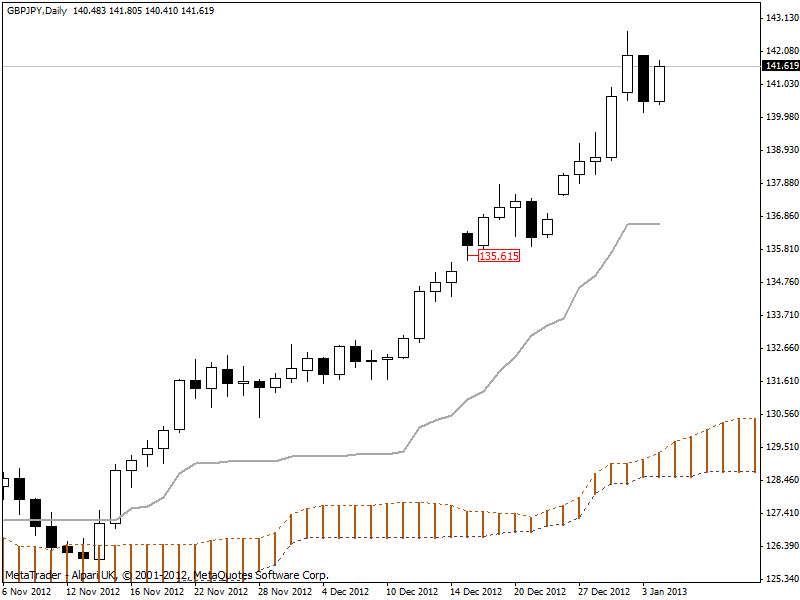
Entry Date 17 December, 2012
Entry Price 135.615
Entry Stop 134.750
Entry Risk 865 pips
Exit Date 8 January, 2013
Exit Price 139.444
Profit 3,829 pips
Max Profit 7,108 pips
Max Drawdown (135.615 - 135.426) = 189
Risk / Reward 0.22
COMMENTS
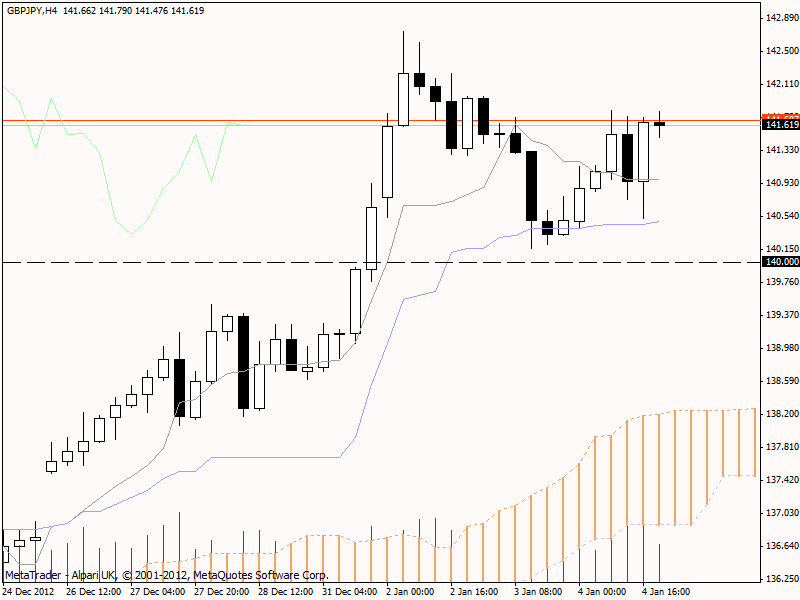
I took 54% of the maximum available profit, which is good because this strategy is designed to take around 40% because it is is a high probability trading strategy. On reflection, it is worth noting that on the 2nd January the tenkan sen began to flatten and price at that point was further than 2,000 pips away. This could have served as an exit signal and is infact one of the things listed in my money management plan to look out for. REMEMBER: Look at your plan DAILY, and ask yourself "are you following the plan?". I clearly was not and had I sold at close on the 2nd I would have walked away with 89% of the available profit! So, on a technical level, this trade was all very nicely implemented but on a management level, I could have done better and achieved outstanding, instead of above average, results.
We live and learn and the markets teach us accordingly!
Anyhow, this is the part where I summarise the trade and see where I could have done better. Remember, post trade analysis is crucial as it reveals how well you followed your trading plan, and how well your trading plan is performing and often highlights any areas for improvement.
STATS VALUE
Entry Date 17 December, 2012
Entry Price 135.615
Entry Stop 134.750
Entry Risk 865 pips
Exit Date 8 January, 2013
Exit Price 139.444
Profit 3,829 pips
Max Profit 7,108 pips
Max Drawdown (135.615 - 135.426) = 189
Risk / Reward 0.22
COMMENTS
I took 54% of the maximum available profit, which is good because this strategy is designed to take around 40% because it is is a high probability trading strategy. On reflection, it is worth noting that on the 2nd January the tenkan sen began to flatten and price at that point was further than 2,000 pips away. This could have served as an exit signal and is infact one of the things listed in my money management plan to look out for. REMEMBER: Look at your plan DAILY, and ask yourself "are you following the plan?". I clearly was not and had I sold at close on the 2nd I would have walked away with 89% of the available profit! So, on a technical level, this trade was all very nicely implemented but on a management level, I could have done better and achieved outstanding, instead of above average, results.
We live and learn and the markets teach us accordingly!
 RSS Feed